Real-Time Pi Monitoring

2025
Real-Time Analytics Dashboard
,
Data Science
The power of the Pi, in the palm of my hand
I recently bought a Raspberry Pi 5 to tinker around with self-hosted LLMs using Docker, Ollama, and Open Web UI. Unsurprisingly, most models either ran slow or hallucinated. As cool as it was to see how powerful this little device was, I didn't want to be at 100% util after running one query. What else could I do with the Pi?
(Insert character or word)top
atop, btop, gtop, htop, bashtop, etc. Raspbian has a variety of flavors when it comes to terminal-based system monitoring tools. In my case, I opted to install btop for viewing system metrics such as temperature, core utilization, disk usage, network activity, and the list goes on.

Cool, I can see system metrics but I don't want to constantly have a terminal window open. Also, anyone can do this in a matter of seconds. Is there a data collection stack out there that allows me to query real-time data in addition to providing analytics via a dashboard?
The power of Prometheus and Grafana, in the palm of my hand (and various config files)
"Prometheus collects and stores its metrics as time series data, i.e. metrics information is store with the timestamp at which it was recorded, alongside optional key-value pairs called labels."
"Grafana enables you to query, visualize, alert on, and explore your metrics, logs, and traces wherever they are stored."
TL;DR: Prometheus collects metrics, Grafana allows you to query and visualize them.
I installed and configured Prometheus with Node Exporter to scrape system metrics every 5 seconds. This captured CPU, memory, disk, network, and system load metrics from the Raspberry Pi.
Service management and auto-start
To ensure automatic recovery after power loss or restarts, I created systemd service files for both Prometheus and Node Exporter to enable startup on boot.
Data storage and retention policies
I had only 1 TB of storage from an NVMe drive connected to the Pi's PCIe 2.0 interface. To prevent data bloat, I configured Prometheus with a 7-day retention policy, allocated 2 GB of storage, and enabled automatic cleanup with rolling 7-day metric windows.
Grafana dashboard creation with real-time visualization
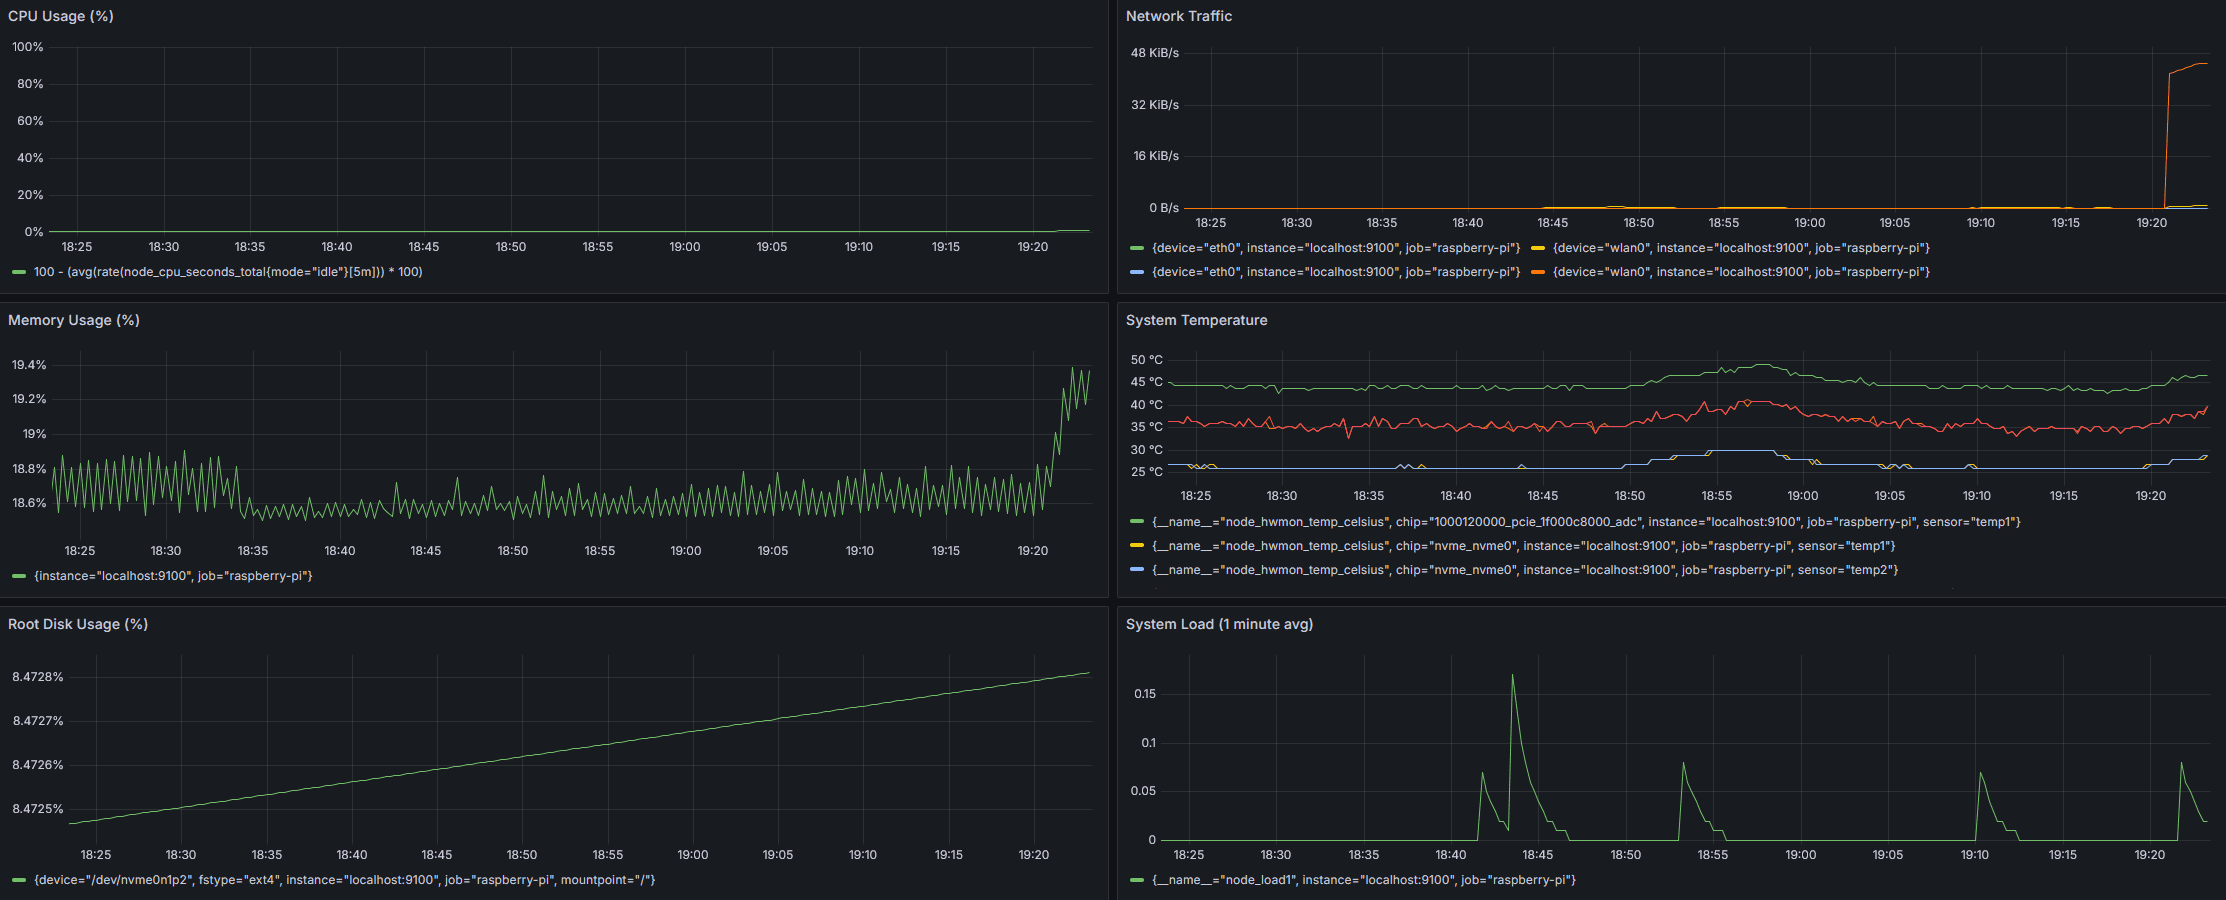
Using PromQL, I built dashboards displaying real-time CPU usage, memory consumption, disk utilization, network traffic, and system load. The visualizations used 1-hour time windows with 10-second auto-refresh intervals.
Grafana makes it easy to configure dashboard panel layouts. However, how do I incorporate validation into the monitoring setup I just created?
Performance testing and validation
To validate monitoring accuracy, I used stress testing that generates CPU and memory load on the system. Just be cautious not to overheat your hardware!
Wrapping up
This monitoring setup demonstrates the kind of end-to-end system thinking that's essential in data analytics and operations roles - from initial data collection and storage optimization to real-time visualization and proactive alerting. What I found interesting is how much you can accomplish with just a Raspberry Pi and some open-source tools, creating a complete monitoring solution that uses minimal resources while providing real-time insights.
