Revenue Operations Analysis

2025
MiQ Northeast Region
,
Data Science
An introduction to MiQ and the given tasks
MiQ is a programmatic media partner for marketers and agencies providing services in predictive analytics, data integration, channel management solutions, etc.
TL;DR: They apply and offer statistical methods to sell data in the advertisement space.
Given a sample of their revenue data from 01/01/2020 - 01/01/2023, I was tasked with identifying three trends in revenue over time in addition to forecasting revenue for the next two quarters: Q1 2023 and Q2 2023.
The report was created using Overleaf's online LaTeX editor and can be accessed by clicking the link below. However, I will also be giving a very brief overview in this post.
Where's the code, Jae? As much as I would love to share the Python code here, I genuinely believe good reports are made in such a way that everyone can understand them.
Clean, validate, observe
The dataset included columns for Year, Quarter, Client Channel, Client, Account, Sales Person, Account Category, Product, and Revenue from the MiQ Northeast Region.
Initial observations of the data after sorting quarterly revenue totals shows an increase in revenue every Q4 followed by a decrease every Q1. However, instead of providing the output from the console was there a better way to show this growth in a visual way?
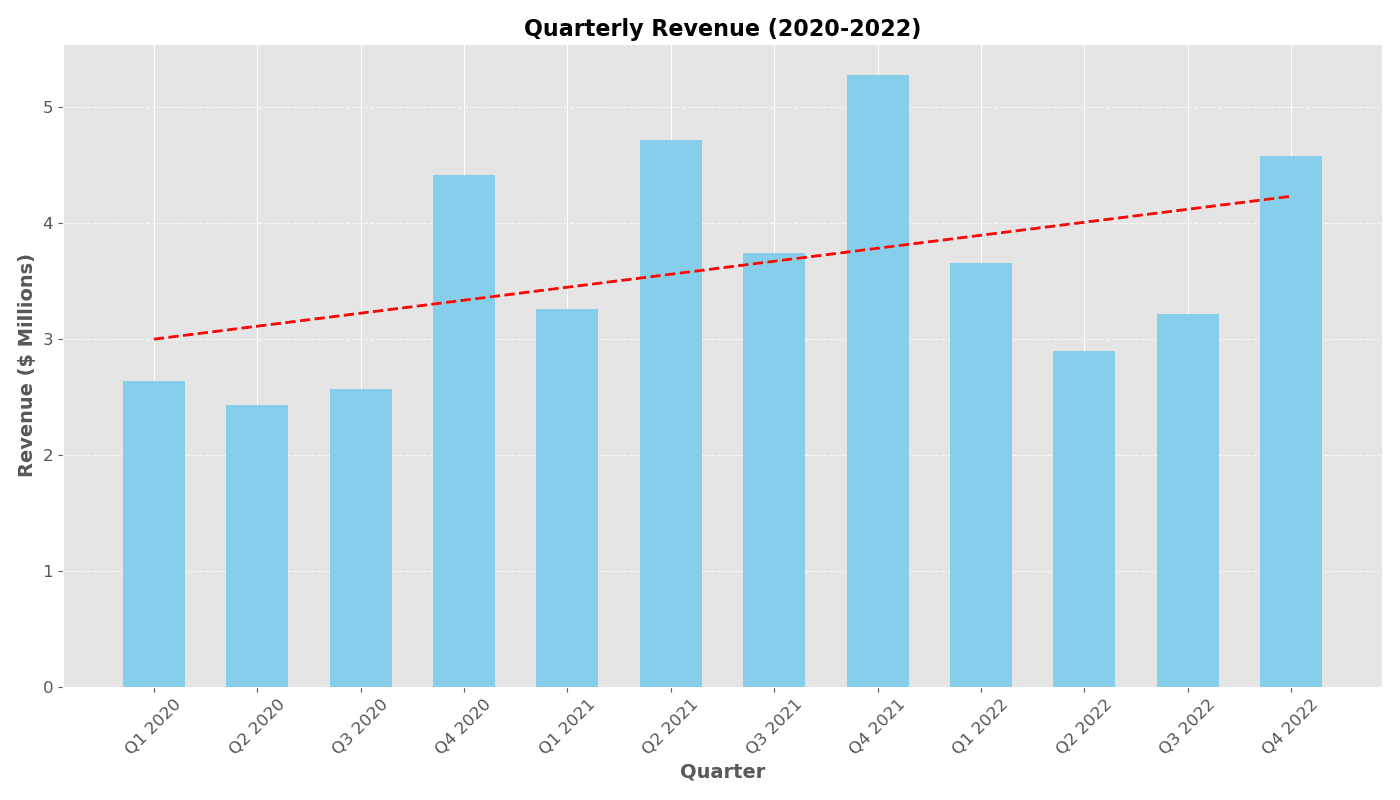
A simple trend line was added given the quarterly revenue totals data. The overall growth rate from Q1 202 to Q4 2022 was 73.73%.
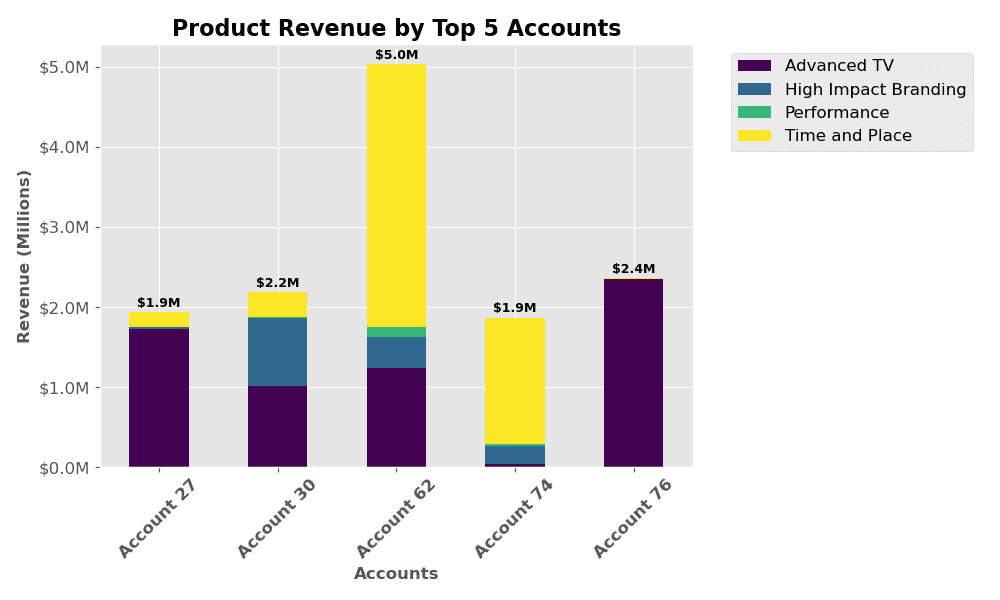
What were the top 5 highest-valued accounts in the dataset in addition to the product mix that contributes to total revenue? In this case, Account 62 has the highest revenue where the products Time and Place and Advanced TV contribute the most to their revenue.
Identifying trends and forecasting revenue
Going back to the Client Channel column, for each unique channel I wanted to:
Look at the quarterly revenue
Apply an exponential moving average (think of this as a trend line)
Place more emphasis or "weight" on recent revenue amounts for each client channel
Take the average of observations nearby in time to mitigate some of the "randomness" in data points
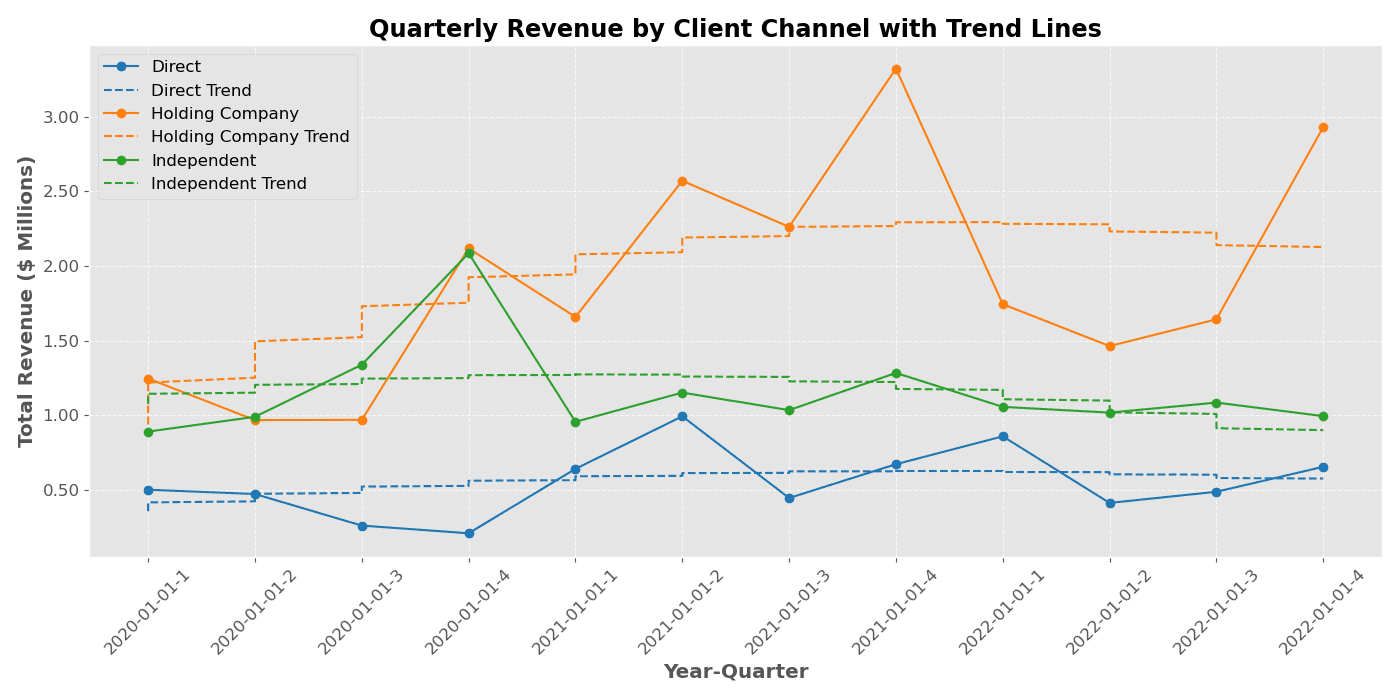
Holding Company constitutes the majority of revenue by 52.79% as opposed to Independent's 31.99%.
In order to forecast revenue for Q1 2023 and Q2 2023, I chose to use Holt-Winters or Triple Exponential Smoothing for the reasons below:
The data has clear, strong quarterly patterns
Upward growth is observed, Holt-Winters is good for handling growth trends and seasonal fluctuations
Assign more weight to recent observations as informed decisions should be based on the current reality of the business
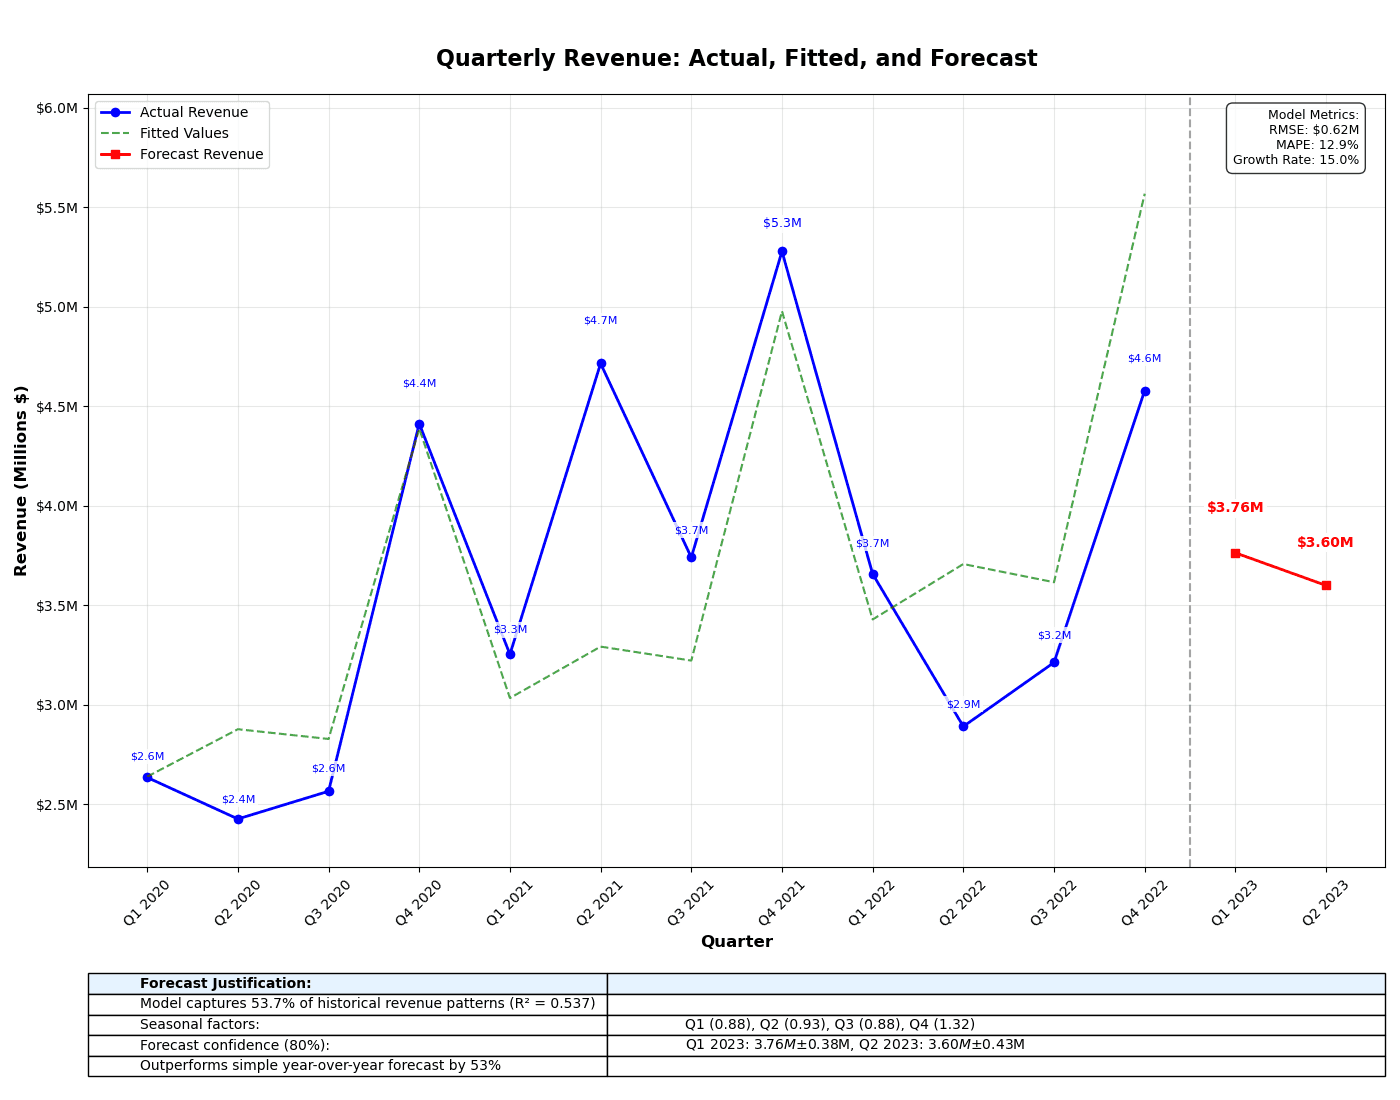
For further technical discussion of the model's performance please click on the report link below. The forecasted revenue for Q1 2023 was $3,763,834.62 and for Q2 2023, $3,599,998.60.
Closing remarks and considerations
Forecast does not account for external macroeconomic factors such as price volatility. In addition, only three years of quarterly data are provided and as such, the model cannot accurately predict total revenue per quarter in the long-term. Seasonality also assumes continuity. Q4 having an increase in revenue followed by a decline in Q1 may not always hold true.
Discover more
